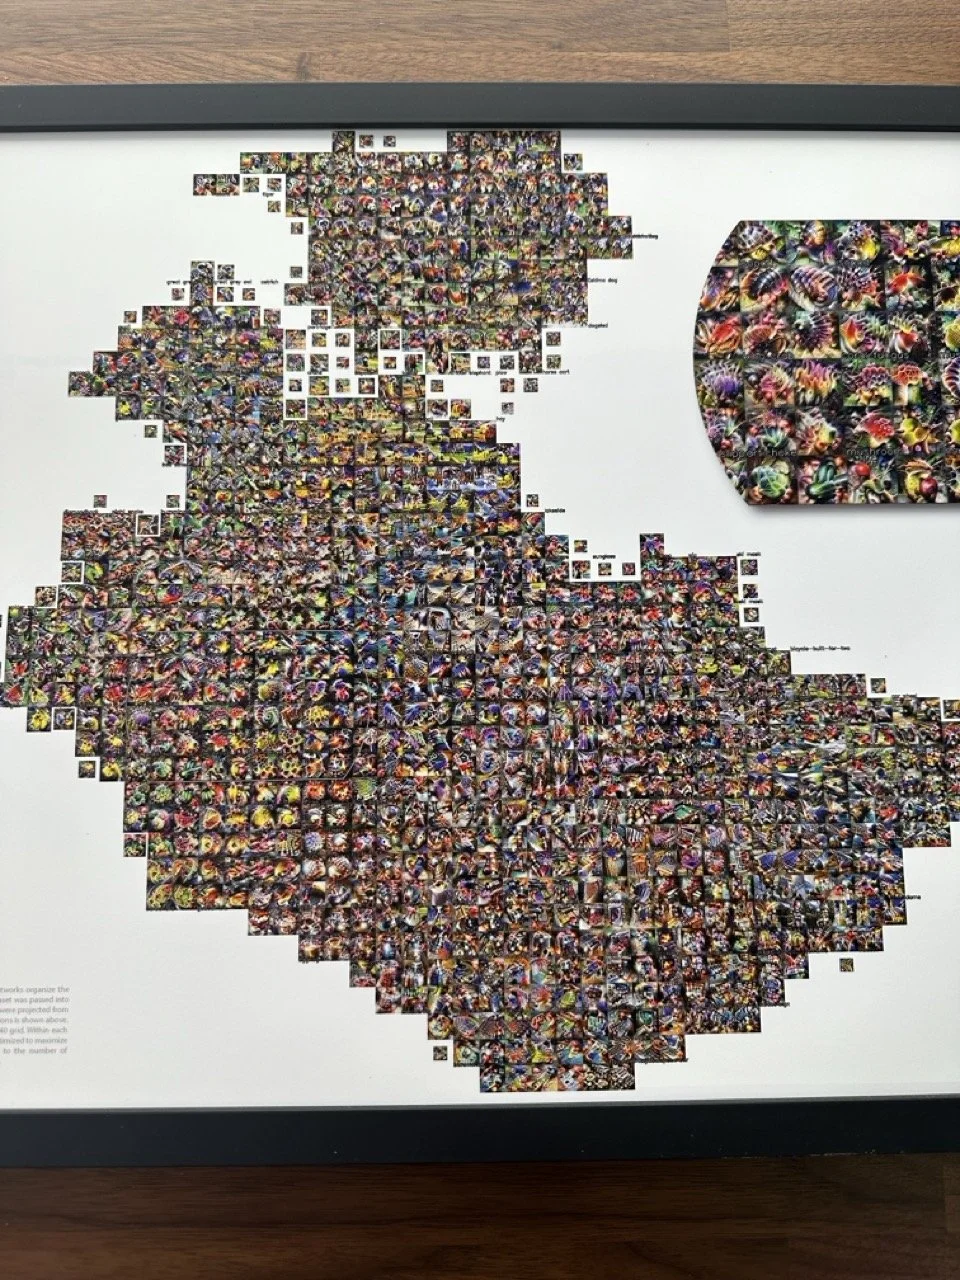
Activation Atlas Poster - Mixed5b - 13"x19”
Activation Atlas Poster - Mixed5b - 13"x19”
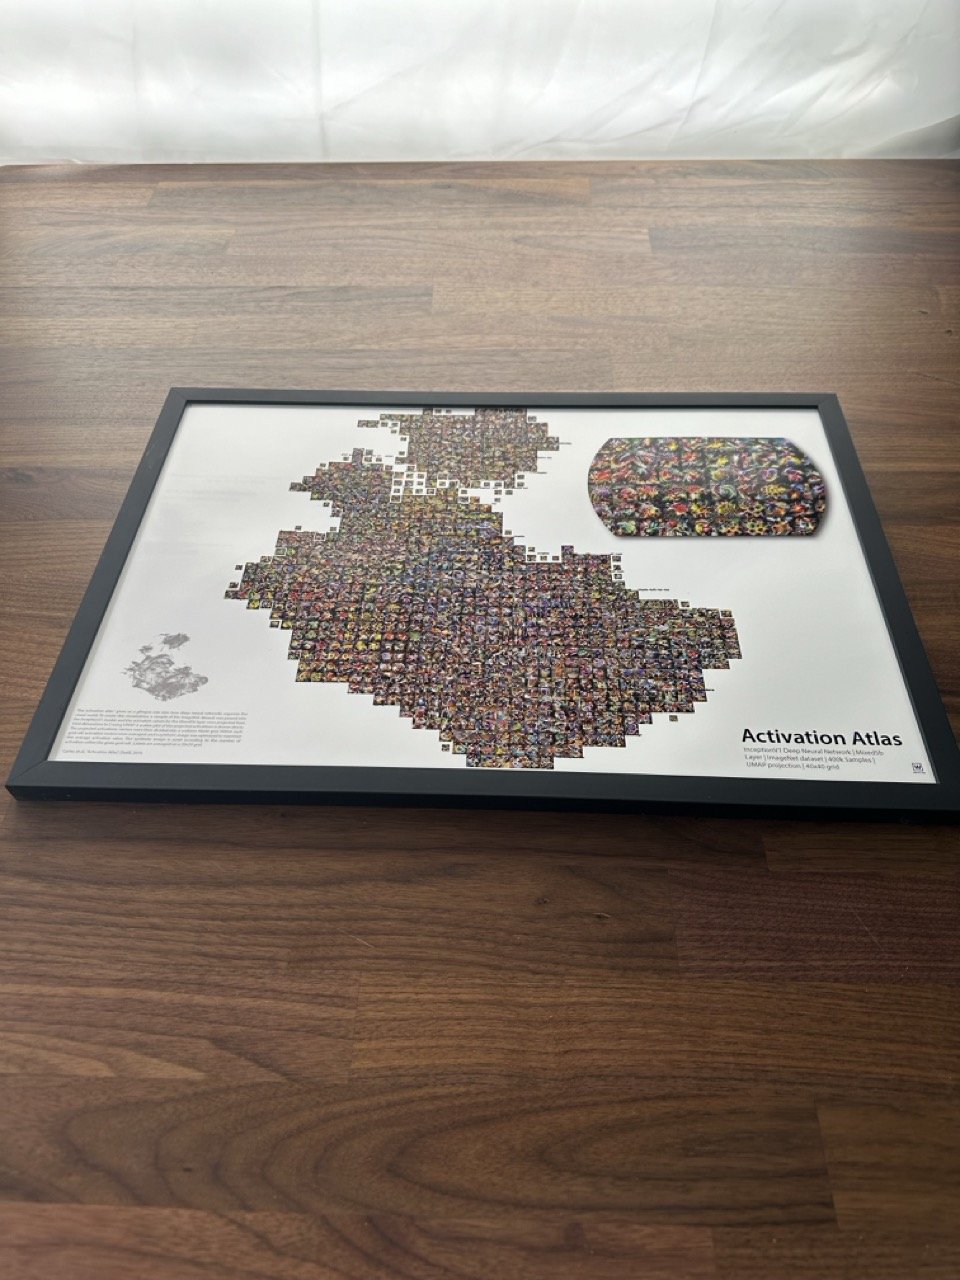
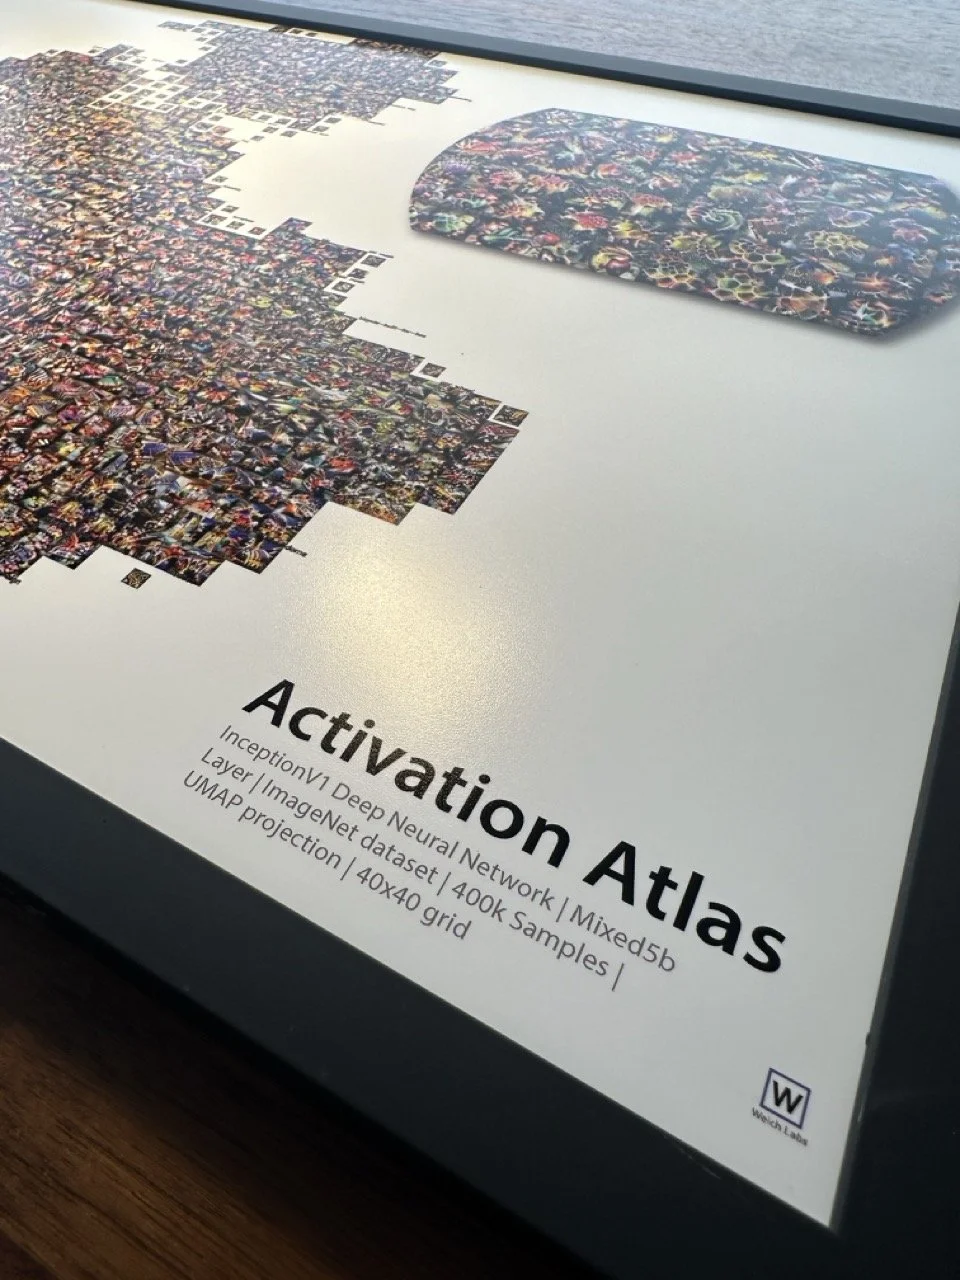
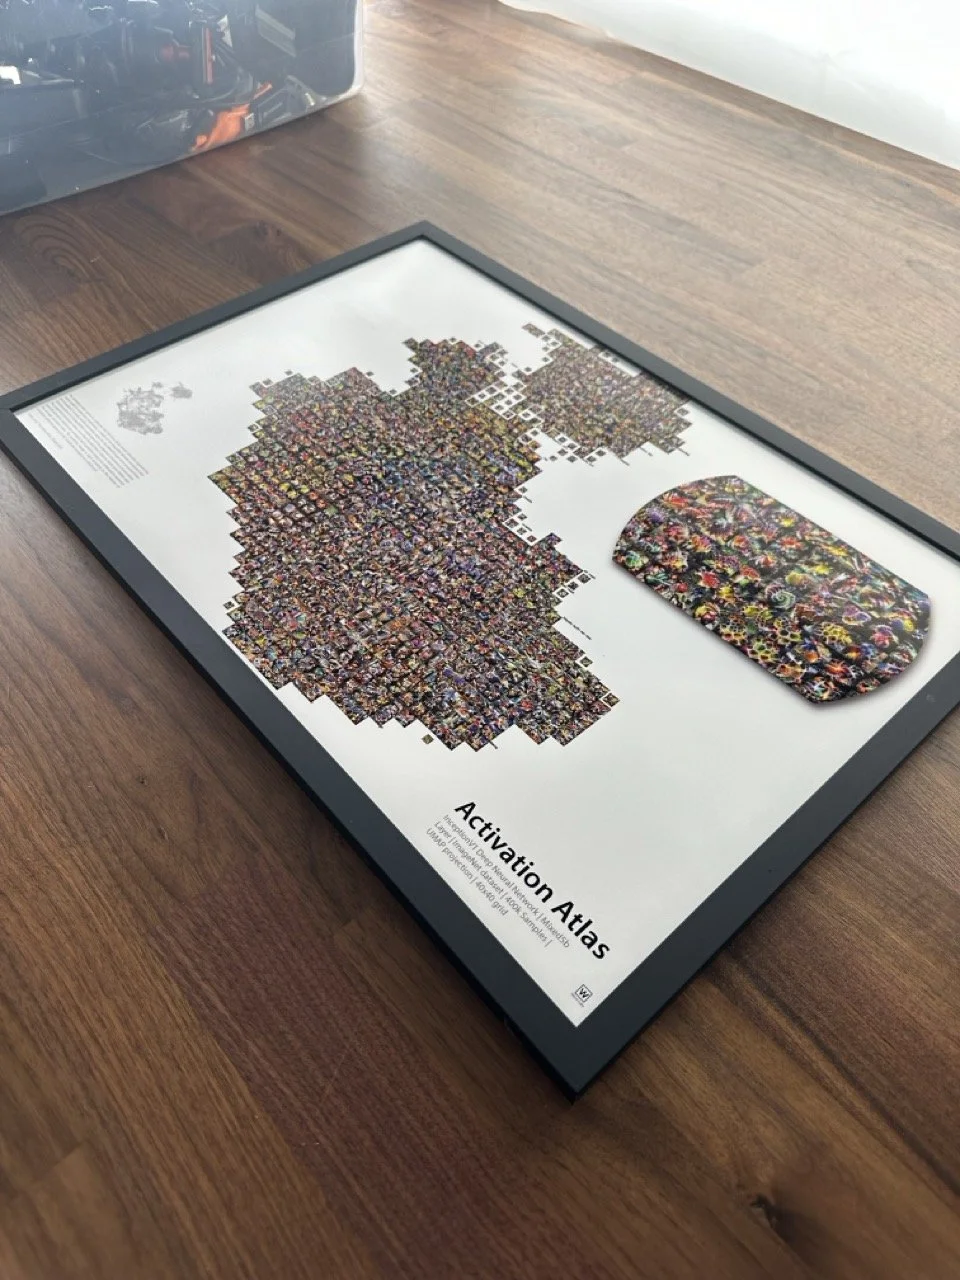
Beautifully rendered super high resolution (5120x5120 pixels) Activation Atlas poster.
Originally published in 2019 [Carter, et al., "Activation Atlas", Distill, 2019.], activation atlases gives us a glimpse into the high dimensional embedding spaces modern AI models use to organize and make sense of the world.
Following the approach in the original publication and using the lucid library, these activation atlases were recomputed at high resolution, and re-rendered to better present in poster format. Original activation Atlases were shared under a creative commons license (https://distill.pub/faq/).
These posters would not be possible without the amazing work in Carter et al, and the lucid library - as a small way to pay it forward 15% of poster profits go to support educational charities.
Printed on high quality Canon paper for excellent color reproduction
Limited first print run
Only shipping to US addresses currently, please allow 3-8 business days for shipping & handling
Frame not included
More About this Atlas
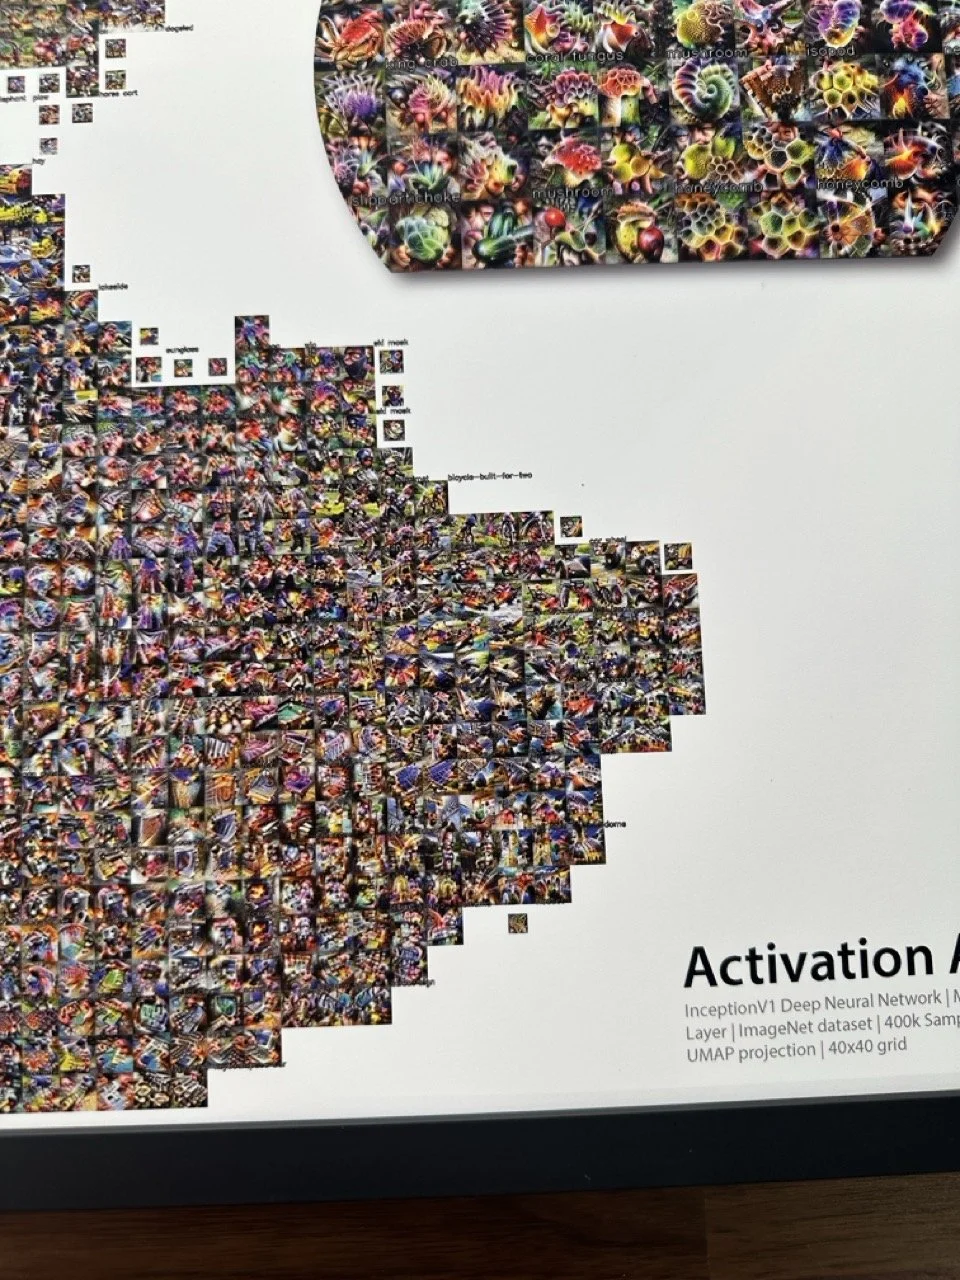
Neighbors on the Activation Atlas are generally close in the embedding space of the model, and show similar concepts that the model has learned. We’re getting a peek into how deep neural networks organize the visual world. To create this visualization, a sample of the ImageNet dataset was passed into the InceptionV1 model, and the activation values for the Mixed5b layer were projected from 1024 dimensions to 2 using UMAP (Uniform Manifold Approximation and Projection for Dimension Reduction). A scatter plot of the projected activations is shown in gray. The projected activations vectors were then divided into a uniform 40x40 grid. Within each grid cell, activation vectors were averaged, and a synthetic image was optimized to maximize this average activation value. The synthetic image is sized according to the number of activation within the given grid cell. Labels are averaged on a 20x20 grid. One way to think about these images is as “what the model is looking for” within this neighborhood in its embedding space.


